
Bitcoin Technical Analysis for Normal People: How to Spot Real Moves in 2026
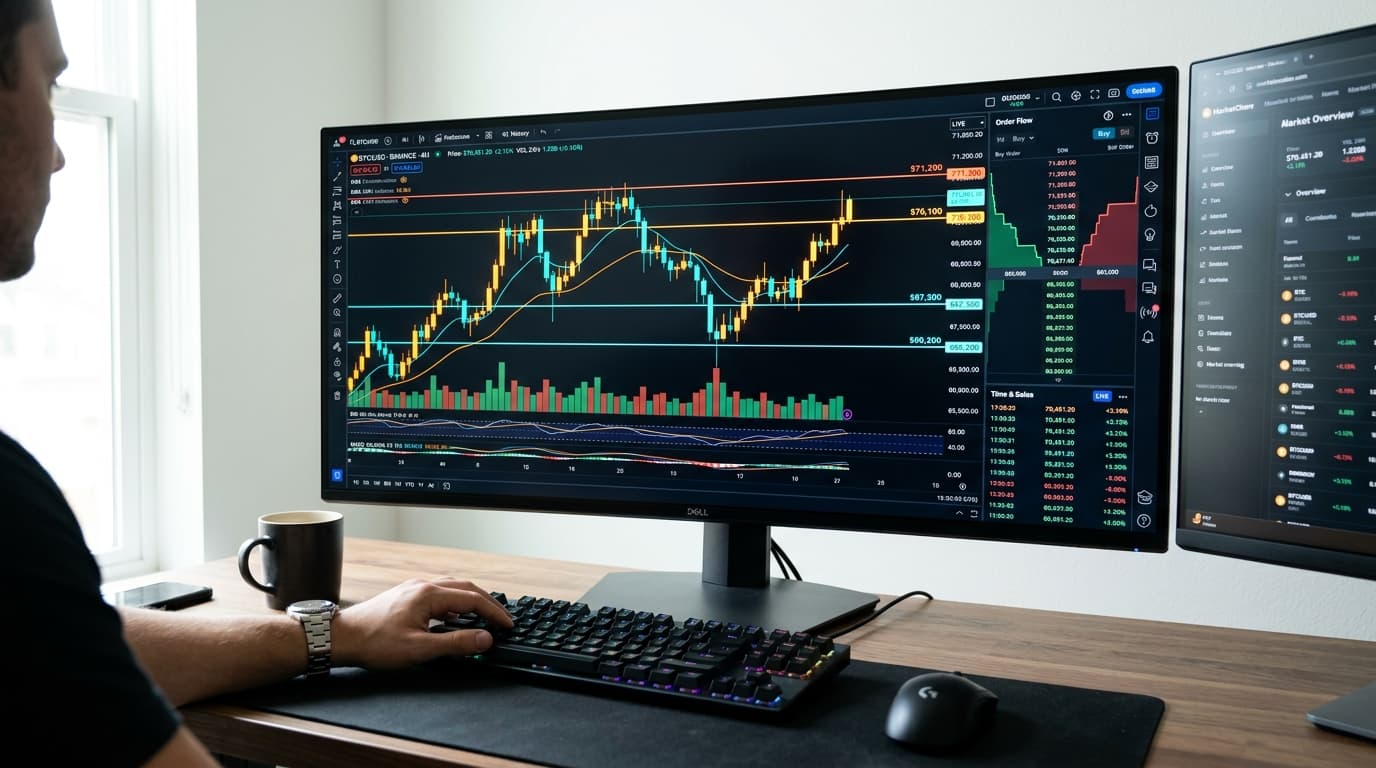
Photo Dispatch: Luminous high-contrast Bitcoin technical analysis trading display showing clean support and resistance levels and order flowSource: Yaga Newsroom Field Wire
“Tired of drawing lines on charts only to watch Bitcoin do the exact opposite? Here is the honest guide to Bitcoin technical analysis: how big money actually hunts stops, how to find true support, and how to trade calmly with clear safety rules.”
Practical Bitcoin technical analysis ignores confusing indicators like lagging moving averages and focuses on two core realities: identifying where large institutions leave their liquidity footprints and placing a strict safety stop-loss where your trade idea is proven wrong before risking capital.
Table of Contents
Bitcoin Chart Reading for People Who Value Their Money
Almost everyone begins their crypto journey the exact same way: you open YouTube, watch a guru draw ten colorful triangles and wavy lines on a Bitcoin chart, and think, "This looks easy! If the blue line crosses the yellow line, I buy!"
Then you put your hard-earned money into a trade. Three minutes later, a sudden red candle appears out of nowhere, wipes out your money, and immediately shoots right back up without you.
This guide is the honest truth about Bitcoin technical analysis. No confusing calculus, no fake promises. Just the simple rules of how big institutions actually move prices, where to enter safely, and how to protect every dollar you own.
The 4 Core Truths of Bitcoin
The Indicator Trap: Why Drawing 10 Lines on a Chart Fails
The biggest mistake new traders make is cluttering their screen with too many tools: RSI, MACD, Bollinger Bands, Stochastic, and five Moving Averages.
Here is the cold, hard truth: all standard indicators are lagging. That means they take the prices from the last 14 or 50 candles, run them through an old mathematical formula, and draw a line. They are looking into the rearview mirror.
An everyday analogy:
Trading Bitcoin using only lagging indicators is like driving your car forward on a highway while staring exclusively into your rearview mirror. You can see where you have been, but you will crash straight into the wall ahead of you.
The Shark Tank: How Big Players Move the Market
To trade Bitcoin successfully, you have to understand who you are swimming with. The crypto market is dominated by algorithmic bots, hedge funds, and market makers.
When an institution wants to buy $50,000,000 worth of Bitcoin, they cannot just click "Buy." If they did that, they would push the price up by $2,000 instantly and end up paying way too much.
So what do they do instead? They go stop hunting:
Spotting the Retail Crowd
Everyone puts their stop-loss in the exact same obvious place—usually just below a recent swing low (for example, right under $60,000).
Triggering the Trap
The big players push price down just enough to hit $59,800. Thousands of retail stop-losses trigger, creating an automatic flood of forced sell orders.
Scooping Up the Cheap Coins
The big institutions happily absorb all those cheap panic sells, filling their massive buy orders. Seconds later, the price skyrockets back up to $63,000.
Finding Real Floors and Ceilings (Not Imaginary Ones)
Instead of drawing 20 diagonal trendlines, look for horizontal levels where price has reacted multiple times on the daily or 4-hour chart.
A Floor (Support): A price area where buyers repeatedly step in because they believe Bitcoin is cheap.
A Ceiling (Resistance): A price area where sellers repeatedly dump because they want to take profit.
The Golden Bounce: When Bitcoin breaks through a ceiling, wait for it to fall back and touch that same level from above. If it bounces, that old ceiling is now your new floor.
Want to see our real results?
We show all our past trades, including the wins and the losses, so you can see our real track record for yourself. No hidden losses, no edited screenshots.
The Emergency Exit: Why a Stop-Loss is Like a Seatbelt
The difference between an amateur gambler and a professional trader comes down to one single concept: Invalidation.
Before you ever click "Buy," you must answer one question: "At what exact price is my idea proven completely wrong?"
If you buy Bitcoin at $64,000 expecting it to bounce off a floor, and the price drops through that floor to $62,800, your idea was wrong. You do not hope. You do not pray. You exit automatically with your stop-loss, take a tiny loss, and keep 98.8% of your money completely safe.
Trade Sizing in Plain English: Sleep Peacefully at Night
Many people think position sizing requires a master's degree in finance. It doesn't. Here is the dead-simple 3-step rule we teach every member of Yaga Calls:
If the trade hits your stop-loss, you lose exactly $30. Your account balance is still $1,970. You can be wrong 10 times in a row and still have nearly all your money left to trade the next big winner!
Want to see our next trade before it happens?
You don't have to pay to watch how we work. We share free trade ideas, chart updates, and warnings in our free group every week so you can watch our methods live.
Do you run a crypto group or have friends who trade?
You can earn money each month just by sharing our trade calls with your community. We do the heavy research, and you earn recurring monthly rewards.
Related Strategic Research & Guides
Ready to Trade with Professional Guidance?
Get narrative-driven setups, strict risk invalidation levels, and precise entry targets sent directly to your private Telegram thread.
Would you hold Bitcoin through an -85% drawdown without panic selling?
Hindsight makes crypto compounding look simple. Run any historical capital allocation through our Crypto Historical Return Calculator to test true peak-to-trough cycle drawdowns across 150+ assets.
Frequently Asked Questions
Recommended Topic Cluster Reading
Best Crypto Signals Group: What Serious Traders Should Look For
Finding the best crypto signals group requires moving beyond simple flash screenshots and guaranteed profit claims. We audit the core pillars of professional signal operations, stop-loss calculations, invalidation rules, and 1-on-1 human onboarding.

Crypto Signals for Beginners: A Practical Guide
A beginner's guide to using crypto trade signals. Learn the exact meaning of entry zones, invalidation parameters, position sizing, and how to avoid emotional mistakes.
Educational & Informational Content Only
All cryptocurrency signal recommendations, narrative analysis studies, timezone liquidity reports, stop-loss calculations, and market structure commentary published by Yaga Calls are intended strictly for educational and informational purposes only. This content does not under any circumstances constitute financial, investment, legal, or tax advice.
Cryptocurrency asset markets are highly speculative, unregulated in many jurisdictions, and carry an extreme risk of financial loss, high volatility, and exchange-side liquidation. Past performance case studies (such as our historical SUI breakout setups) do not under any circumstances guarantee or predict future market results. Always implement proper position-sizing limits, never average down on a failing position, and never trade with capital you cannot afford to lose.