
Fear & Greed Index vs Market Structure: How to Interpret Sentiment Data
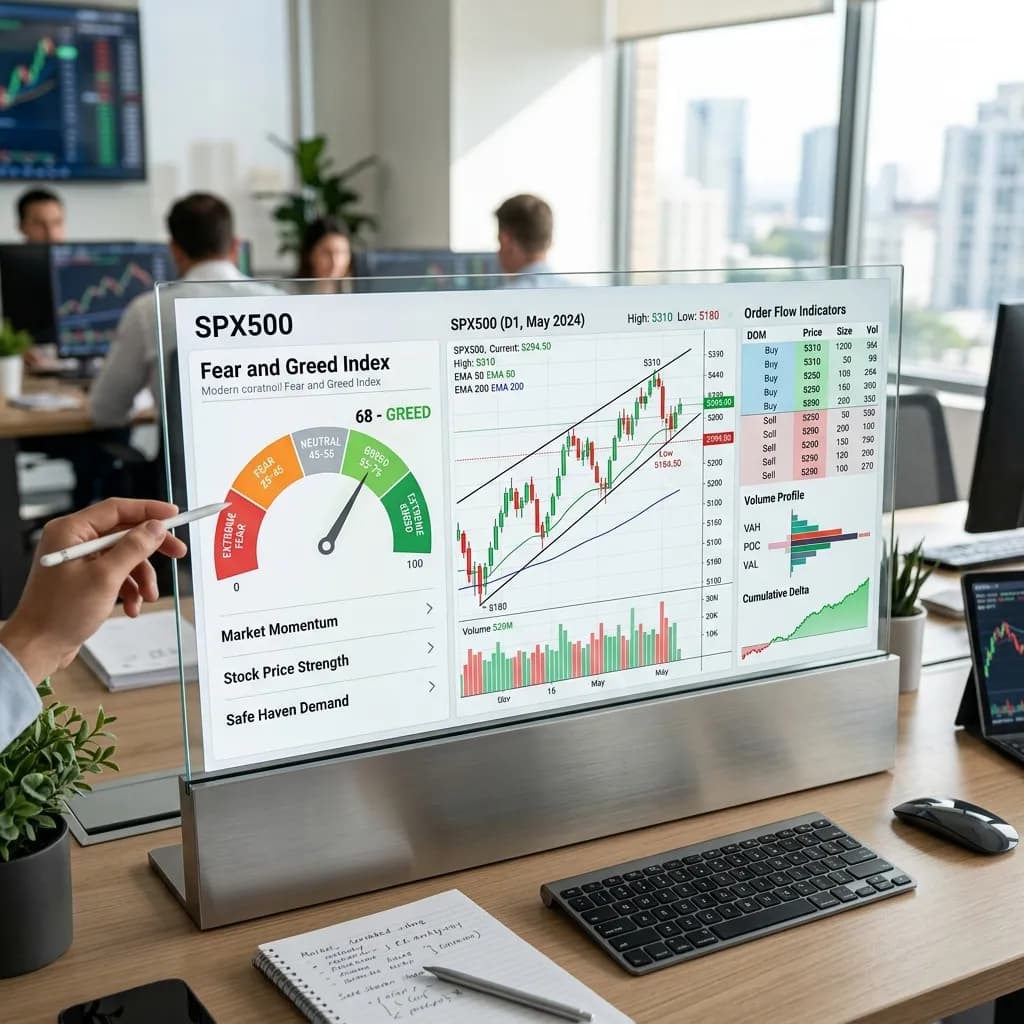
Photo Dispatch: Market sentiment Fear and Greed meter alongside technical candlestick charts and order flow indicatorsSource: Yaga Newsroom Field Wire
“Advanced search intent in emerging datasets highlights tools like the Fear & Greed Index and Crypto Bubbles. Discover how to combine sentiment metrics with technical price structure.”
Table of Contents
Advanced search queries for the Fear & Greed Index (Breakout) and Crypto Bubbles (+130%) indicate a growing demand for sentiment visualization. Discover how professional swing traders combine emotional sentiment gauges with technical market structure and order flow.
What is the Crypto Fear & Greed Index?
The Crypto Fear & Greed Index aggregates market volatility, trading volume, social media sentiment, Bitcoin dominance, and Google Trends query data into a single 0-to-100 score. A score near 0 represents Extreme Fear (potential oversold bottoms), while 100 indicates Extreme Greed (potential overbought tops).
Decoding Advanced Sentiment Search Queries
In our regional search datasets, tools like “fear and greed index crypto” and “crypto bubbles” appeared alongside mainstream exchange searches. This reveals a secondary cohort of intermediate traders seeking visual market tools to interpret market cycles.
Why Market Structure Trumps Emotional Gauges
While sentiment indicators provide helpful macro context, they fail as standalone trade entry signals. During prolonged bear trends, a market can remain in “Extreme Fear” for months while prices drop further. Conversely, strong bull trends can sustain “Extreme Greed” for weeks as altcoins rally.
Professional traders rely on market structure: horizontal support/resistance levels, accumulation ranges, volume profiles, and strict stop-loss invalidation points.
Combining Sentiment Intelligence with Strict Risk Rules
At YagaCalls, sentiment analysis is used to gauge broader market regime context. However, trade execution is strictly governed by quantitative risk parameters, entry zones, and mandatory stop-losses.
Verify YagaCalls Trade Proof:
Explore our verified historical trade setups, win-rate transparency, and 1-on-1 human onboarding guidelines.
Related Strategic Research & Guides
Ready to Trade with Professional Guidance?
Get narrative-driven setups, strict risk invalidation levels, and precise entry targets sent directly to your private Telegram thread.
Would you hold Bitcoin through an -85% drawdown without panic selling?
Hindsight makes crypto compounding look simple. Run any historical capital allocation through our Crypto Historical Return Calculator to test true peak-to-trough cycle drawdowns across 150+ assets.
Frequently Asked Questions
Recommended Topic Cluster Reading
Why Stop Loss Matters in Crypto Signals
In a 24/7 market, a non-negotiable stop loss is your only insurance policy against liquidation. We break down the mathematical reality of drawdowns, invalidation levels, and position sizing.

Narrative Trading in Crypto: How Market Stories Move Altcoins
Technical indicators alone fail in volatile altcoin cycles. Master the art of narrative velocity, sector rotation, and tracking catalysts like AI, RWA, and DePIN.
Educational & Informational Content Only
All cryptocurrency signal recommendations, narrative analysis studies, timezone liquidity reports, stop-loss calculations, and market structure commentary published by Yaga Calls are intended strictly for educational and informational purposes only. This content does not under any circumstances constitute financial, investment, legal, or tax advice.
Cryptocurrency asset markets are highly speculative, unregulated in many jurisdictions, and carry an extreme risk of financial loss, high volatility, and exchange-side liquidation. Past performance case studies (such as our historical SUI breakout setups) do not under any circumstances guarantee or predict future market results. Always implement proper position-sizing limits, never average down on a failing position, and never trade with capital you cannot afford to lose.